Abstract
Objective: To investigate the prognostic significance of total metabolic tumor volume (TMTV) and total lesion glycolysis (TLG) in patients with follicular lymphoma (FL) at baseline and mid-treatment with 18F-fluorodeoxyglucose positron emission tomography-computed tomography (PET/CT) scans.
Subjects and methods: The study analyzed data from 48 patients with FL who were treated in Jiangsu Province Hospital and reviewed their baseline PET/CT scans. TMTV and TLG were computed by using the absolute value of 2.0, 2.5 and 3.0 thresholding method respectively. Furthermore, 24 interim PET/CT scans of the patients were researched. For interim scans, we recorded the changes in TMTV and TLG, which were defined as ΔTMTV3.0 and ΔTLG3.0.
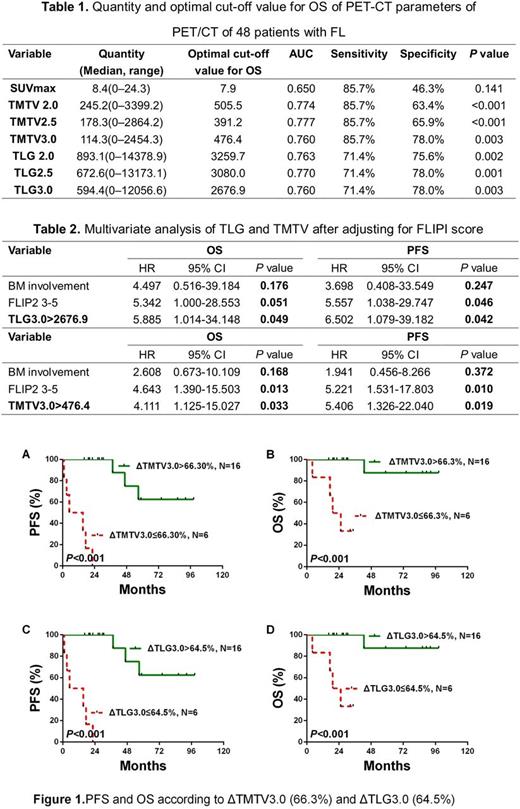
Results: Median age was 53 years, 75.0% of patients had stage III to IV disease, 43.8% had a Follicular Lymphoma International Prognostic Index 1 (FLIPI1) score of 3 to 5 and 20.8% had a FLIPI2 score of 3 to 5. Most patients (40/48, 83.3%) received immunochemotherapy with rituximab, cyclophosphamide, epirubicin, vindesine and prednisone (R-CHOP) and 3 patients received radiotherapy while the other 5 patients didn't receive treatment due to no indications. Median follow-up is 35 months (range, 16-98 months). ROC curve analysis showed that the optimal cut-off values for SUVmax, TMTV2.0, TMTV2.5, TMTV3.0, TLG2.0, TLG2.5 and TLG3.0 of 7.0 (sensitivity 85.7%; specificity 46.3%; AUC (areas under the curve) 0.650; P=0.141), 505.5 (sensitivity 85.7%; specificity 63.4%; AUC 0.774; P <0.001), 391.2 (sensitivity 85.7%; specificity 65.9%; AUC 0.777; P <0.001), 476.4 (sensitivity 85.7%; specificity 78.0%; AUC 0.760; P=0.003), 3259.7 (sensitivity 71.4%; specificity 75.6%; AUC 0.763; P=0.002), 3080.0 (sensitivity 71.4%; specificity 78.0%; AUC 0.770; P=0.001) and 2676.9 (sensitivity 71.4%; specificity 78.0%; AUC 0.760; P=0.003) (Table 1). Taking sensitivity, specificity and AUC into consideration, we selected TMTV3.0 and TLG3.0 for further analyses. By univariate analysis, we found that BM involvement, FLIPI2 score of 3-5, TLG3.0>2676.9 and TMTV3.0>476.4 were both significantly associated with inferior PFS and OS in our cohort. On multivariable analysis, TMTV3.0 and TLG3.0 were independent predictors of both progression-free survival (PFS) (HR=5.406, 95%CI: 1.326-22.040; P=0.019 and HR=6.502, 95%CI: 1.079-39.182; P=0.042) and overall survival (OS) (HR=4.111, 95%CI: 1.125-15.027; P=0.033 and HR=5. 885, 95%CI: 1.014-34.148; P=0.049) (Table 2). ROC curve analysis showed the optimal cut-off values for ΔTMTV3.0and ΔTLG3.0 were 66.3% (sensitivity 85.7%; specificity 63.4%; AUC 0.774; P <0.001) and 64.5% (sensitivity 85.7%; specificity 65.9%; AUC 0.777; P <0.001). Kaplan-Meier PFS and OS curves for the ΔTMTV3.0 (66.3%) and ΔTLG3.0 (64.5%) using the optimal cut-off value are shown in Figure 1.
Conclusion: Baseline TMTV and TLG are strong predictors of PFS and OS in FL. Furthermore, interim TMTV (ΔTMTV>66.3%) and TLG (ΔTLG>64.5%) reduction are valuable tools for early treatment response assessment in FL patients.
No relevant conflicts of interest to declare.
Author notes
Asterisk with author names denotes non-ASH members.


This feature is available to Subscribers Only
Sign In or Create an Account Close Modal